In 2013, as I was about to start at Twitter, Alex Howard wrote a piece pondering on just what a data journalist would do at a tech company.
Now, as I’m about to begin a new adventure, I thought I should collect together a selection of the projects worked on with some amazing developers and others over the past couple of years. So here’s a bit of what this data journalist did at Twitter (with some help).
1) Twitter Reverb
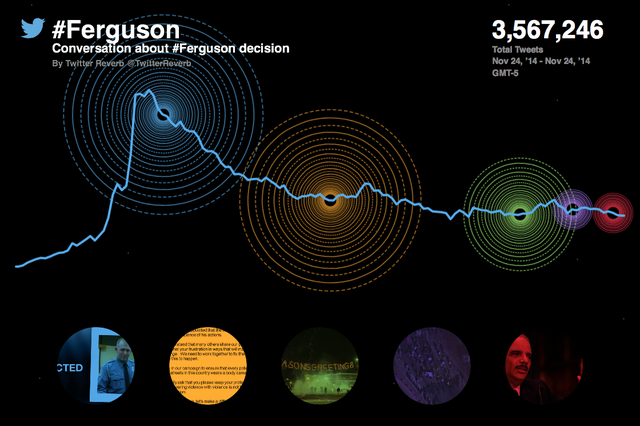
Twitter Reverb on the Ferguson Grand Jury decision
Twitter Reverb is a tool for journalists to visualise conversations on Twitter created with Periscopic and erstwhile Twitter creative guru James Buckhouse. You can read more about how we made it here on Source. The latest version can be used to compare more than one term and you can see more examples of how different news teams have used it here:

Twitter Reverb on “The Dress”
2) Maps

The sun rises on Twitter
Want to see how the sun rises on Twitter? Or the reaction to #JeSuisCharlie?

#jesuischarlie
Or how (and when) the Super Bowl lit up America? We’ve worked a lot with mapping geotagged Tweets to tell stories around the big events, often using a free tool: CartoDB. Here are some more these animated maps and you can read more about the challenges (and fun stuff) of mapping Twitter here.
And this is what happens to the followers of a famous actor when he sends his first ever Tweet:
New followers of Robert Downey Jr after his first Tweet
3) Interactives
The below are just a selection built with interactive designers Nicolas Belmonte and Krist Wongsuphasawat. You can find more of their amazing work here.
State of the Union

State of the Union speech on Twitter. Nicolas Belmonte
NFL followers map

NFL followers mapped. Krist Wongsuphasawat
How politicians follow each other
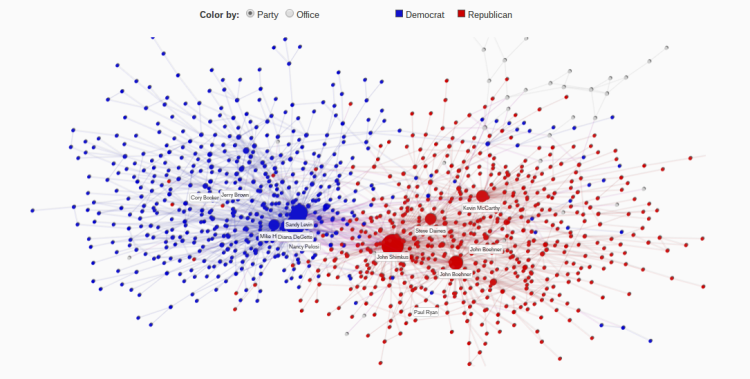
Mutual follows among U.S. politicians. Nicolas Belmonte
Happy New Year
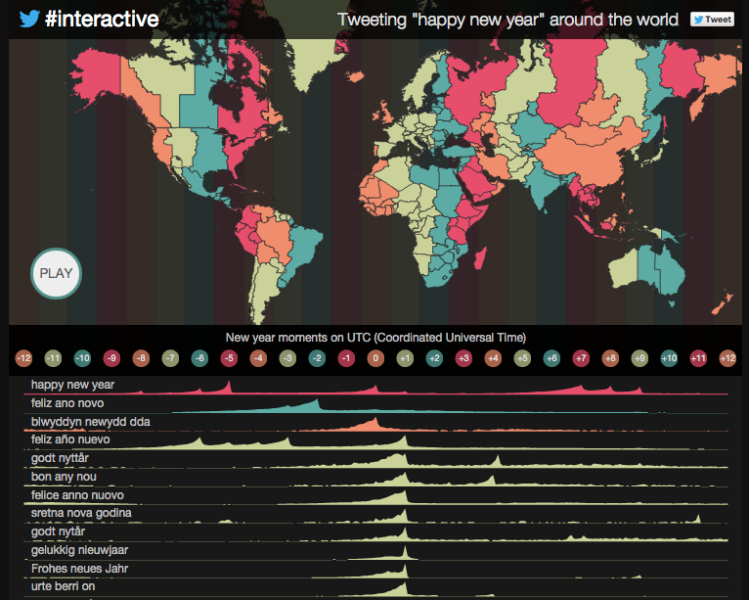
Happy New Year 2015. Krist Wongsuphasawat
Doctor Who

Doctor Who’s most retweeted Tweets. Nicolas Belmonte
#NelsonMandela
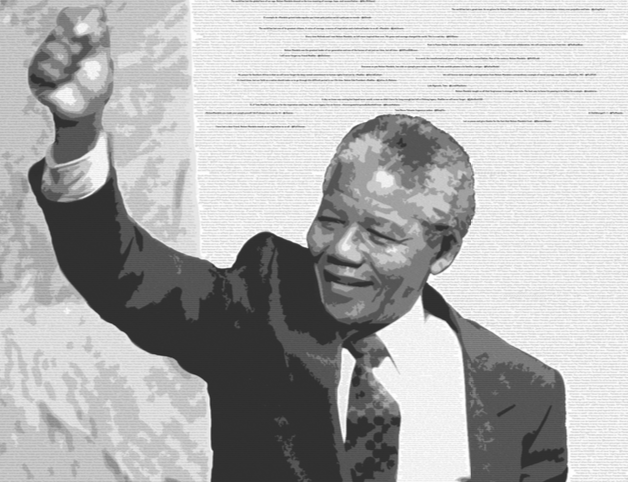
Farewell Nelson Mandela, on Twitter. Miguel Rios
Comprising of thousands of Tweet tributes, this was designed by Miguel Rios — you can see the full version here.
4) When people do stuff
How people use Twitter to Tweet at different times.
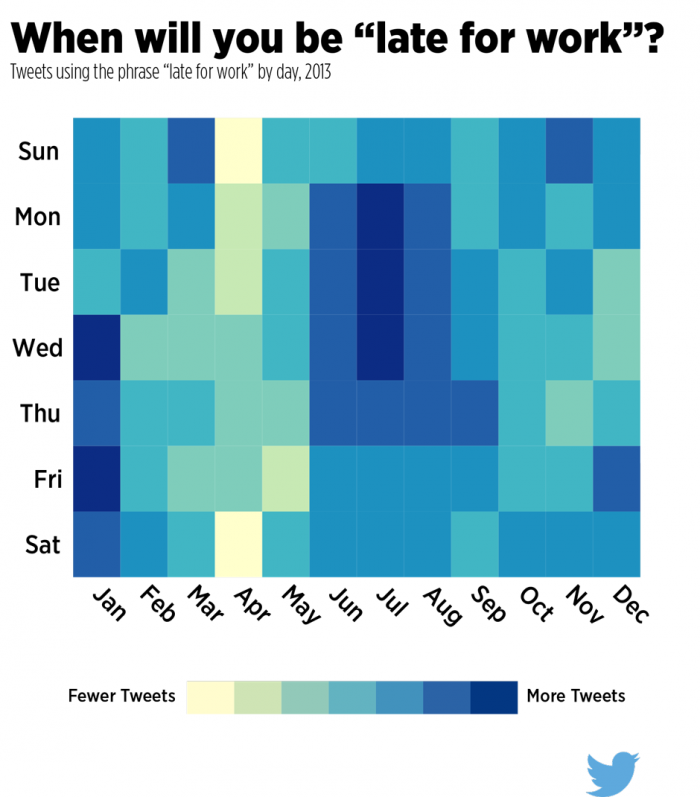
Late for work on Twitter
5) The most viral images around news events
Treemaps of the most viral images around events and moments, using a simple visual tool designed by Nicolas Belmonte.
Farewell Maya

#ThankyouMaya
#Ferguson

#Ferguson on Twitter
6) How people use Twitter
Analysis of how Twitter was used during the Boston bombing, and the effects of different types of Tweeting on engagement. You can read more of these types of blog posts here (including how to make a #datavine). You can even find out who the most influential Tweeters were around Sharknado. You can pretty much see everything by taking a look at @TwitterData, which we set up just after I joined the company.


Reblogged this on andreaspinopico and commented:
Un giornalista, analista dei dati su Twitter
Posted by andreaspinopico | March 24, 2015, 10:19 am