
Birdwatching is getting really popular: 96 million people in the US are birders and that produces a lot of Search data. And that means there is a lot of potential for beautiful data visuals (a great example is Jer Thorp’s work in the field). So, when Nadieh Bremer told Alberto and I that her next visual would be an exploration of Google Trends data around birds in America, we knew this would be something to look forward to.
And today, Searching For Birds is published.
It’s an incredible piece: forensically exploring how Americans search for our feathered friends.
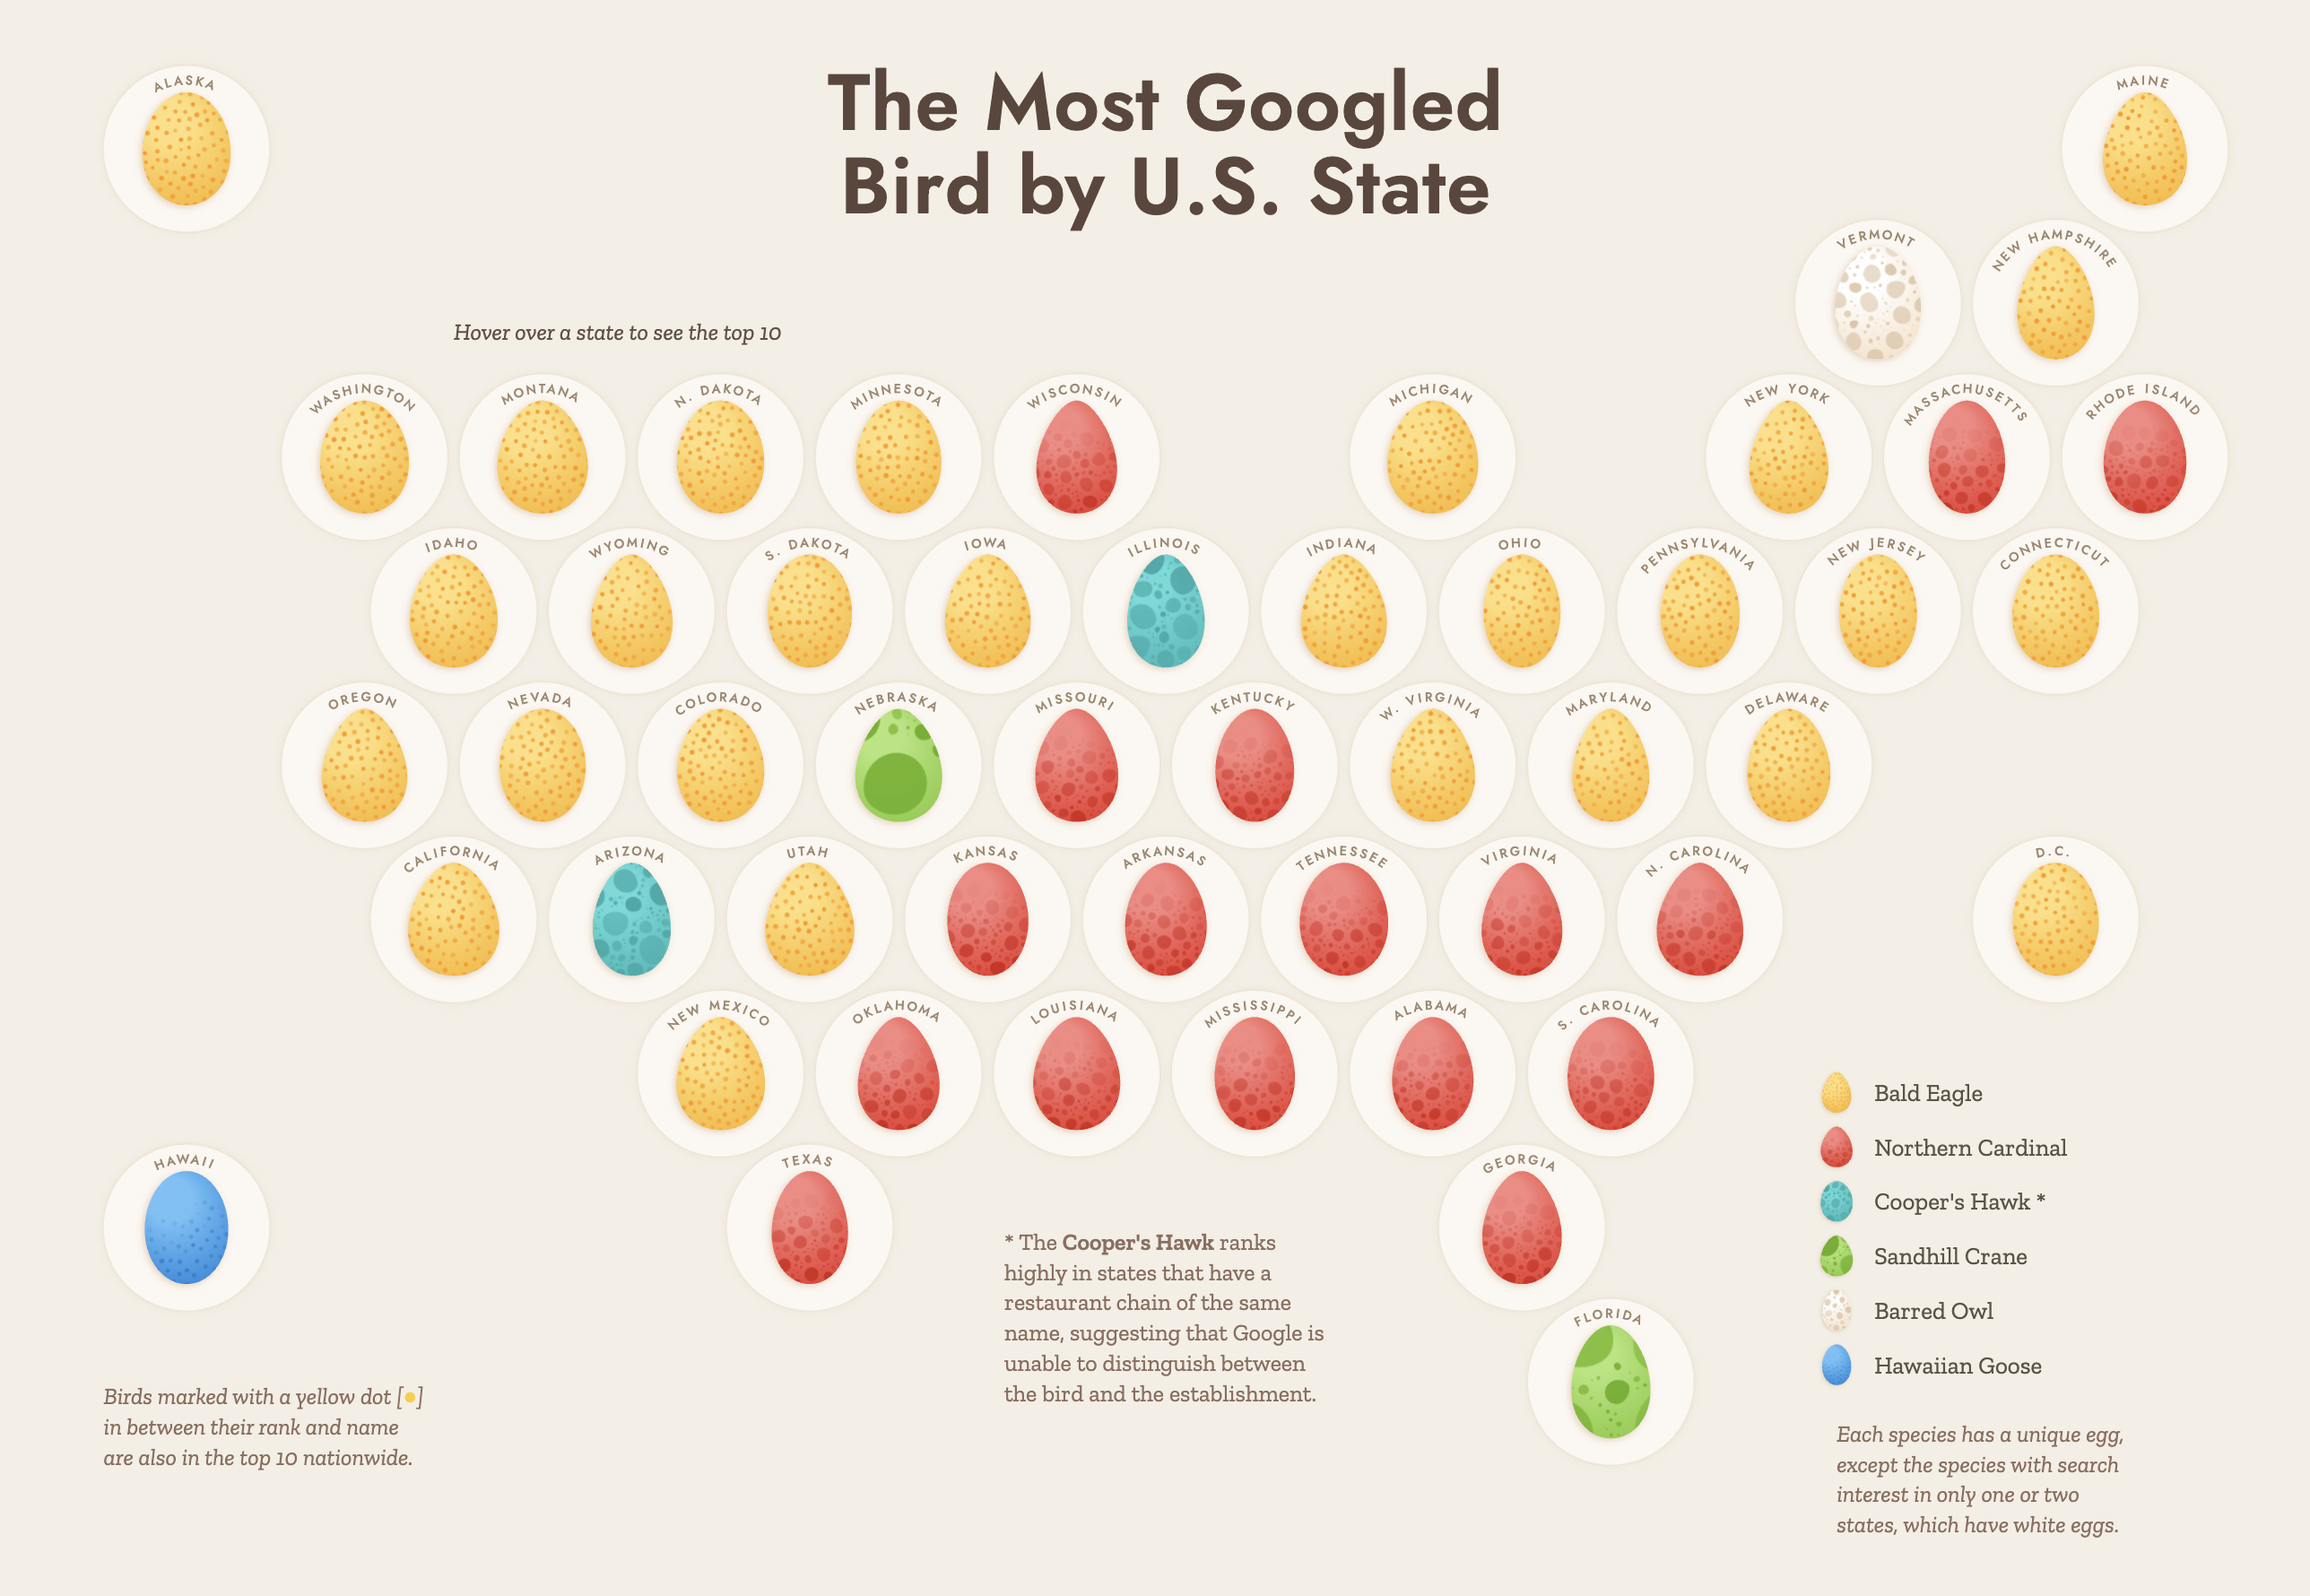
It’s as much art as data visualisation: illustrations of birds are seamlessly woven into charts and maps.
And tomorrow the Great Backyard Bird Count begins, so the timing seems right.
Making art fun and human is what Nadieh does. One of my favourite Google Trends project ever was her exploration of why dogs and cats do weird things (Why Do Cats and Dogs?), and I still use it to talk about the importance of humanity in data visuals all the time.
The world may seem insane on a regular basis, sometimes it’s important just to appreciate the beauty we have around us. Searching for Birds is a way to do that.


Leave a comment