Skip to content
Simon Rogers
Home
About
Archives
Contacts
Data Journalism Podcast
What We Ask Google
Speaking & interviews
Training
Animations
Facts are Sacred
On guardian.co.uk
Tag:
dataviz
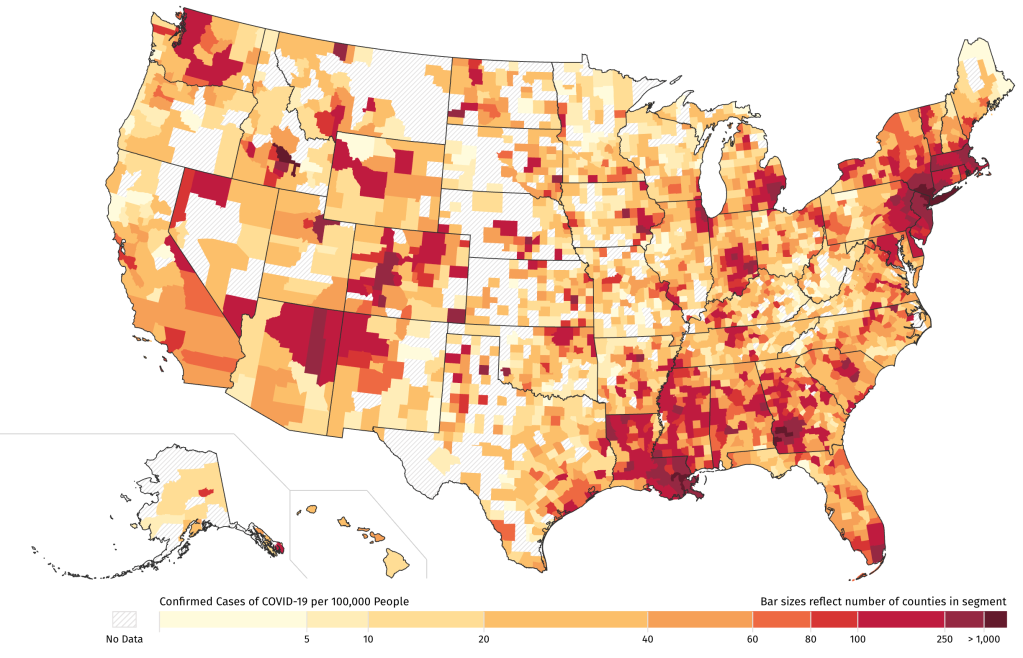
How local journalists can map COVID-19 cases
April 15, 2020
A new free online course in Data Journalism
September 26, 2019
A decade of working in data journalism: what has changed?
April 24, 2019
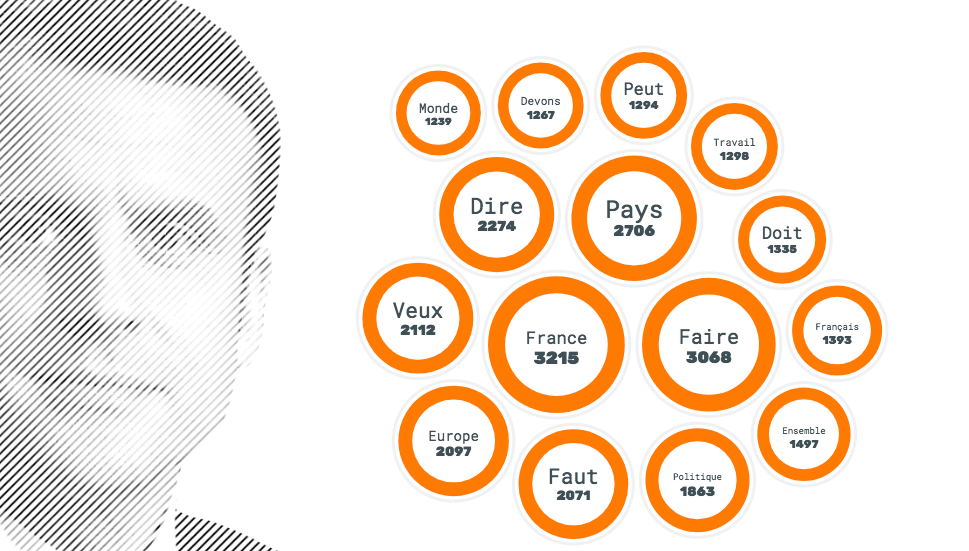
The weight of words (and data)
June 8, 2018
Want to build a VR network chart? Here’s a way to do it without coding
March 6, 2018
Visual journalism gallery: images from the world’s best newsrooms and designers
November 14, 2017
Data needs empathy to make it real
April 25, 2017
Building an Alternative Olympic Medal Table
August 12, 2016
How to make a multi-screen interactive
September 19, 2015
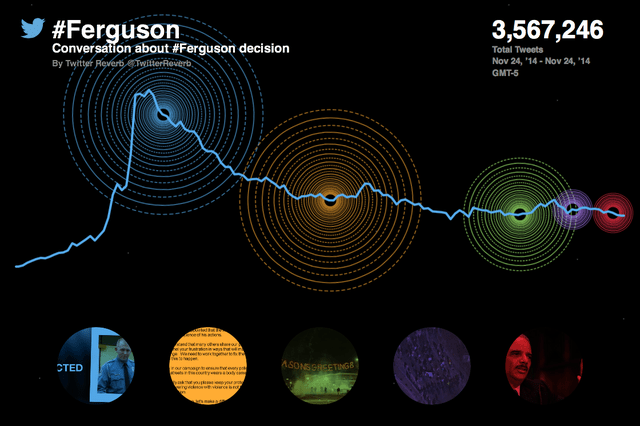
A data journalist at Twitter
March 9, 2015
Previous Page
1
2
3
4
5
6
Next Page
Subscribe
Subscribed
Simon Rogers
Join 187 other subscribers
Sign me up
Already have a WordPress.com account?
Log in now.
Simon Rogers
Subscribe
Subscribed
Sign up
Log in
Report this content
View site in Reader
Manage subscriptions
Collapse this bar