Skip to content
Simon Rogers
Home
About
Archives
Contacts
Data Journalism Podcast
What We Ask Google
Speaking & interviews
Training
Animations
Facts are Sacred
On guardian.co.uk
Author:
Simon Rogers
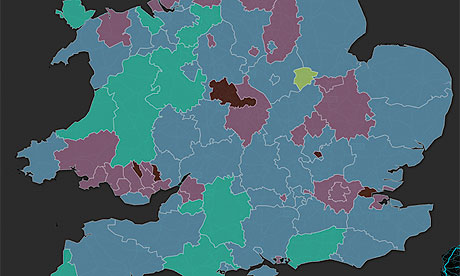
If devolution killed national data, what would Scottish independence do?
September 15, 2014
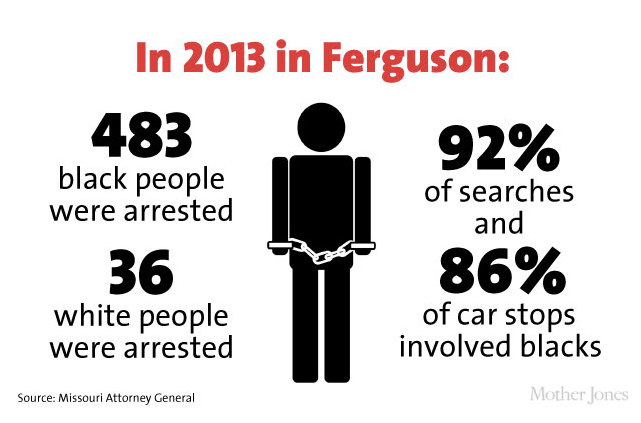
What data journalism told us about #Ferguson
August 16, 2014
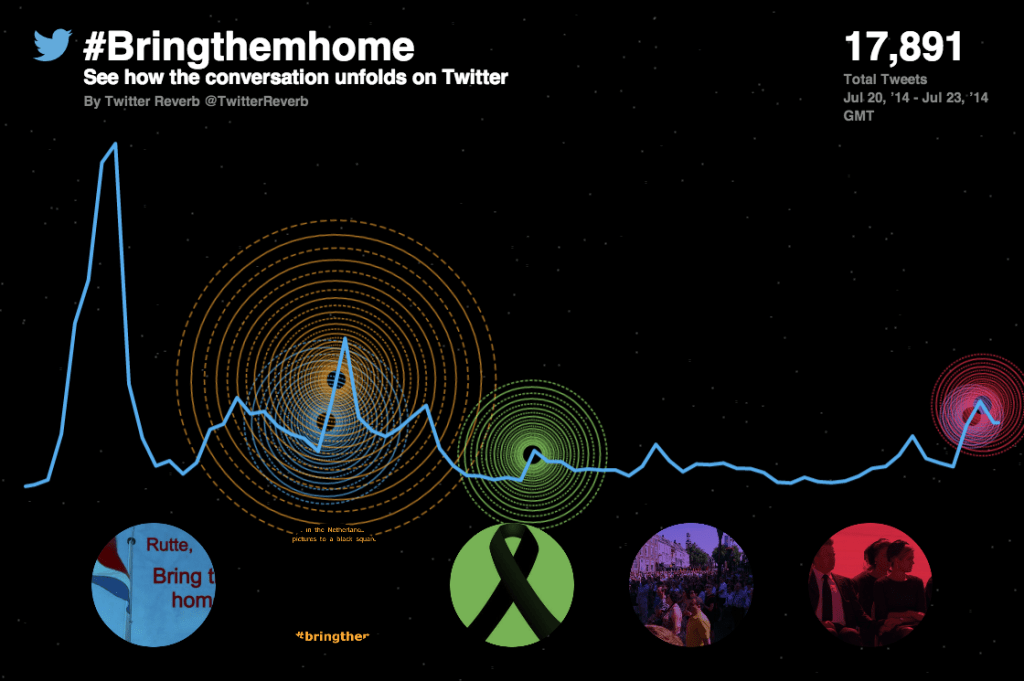
Twitter Reverb: how we made a new #dataviz tool
August 14, 2014
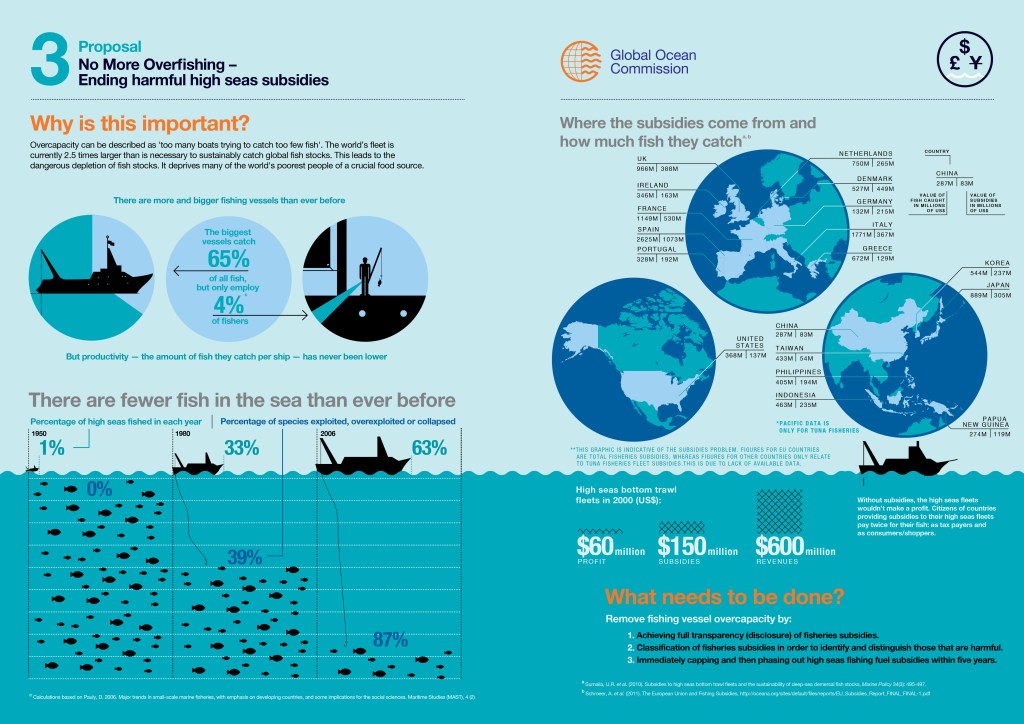
Saving the oceans: with data
July 17, 2014
Data journalism needs to go mobile
May 29, 2014
Introduction to data journalism
May 25, 2014
Data journalism: learn how to do it for free
May 2, 2014
Data journalism only matters when it’s transparent
April 24, 2014
Gallery: taking #dataviz beyond infinity
April 23, 2014
How to make an animated map with CartoDB and Torque
March 17, 2014
Previous Page
1
…
8
9
10
11
12
…
14
Next Page
Subscribe
Subscribed
Simon Rogers
Join 187 other subscribers
Sign me up
Already have a WordPress.com account?
Log in now.
Simon Rogers
Subscribe
Subscribed
Sign up
Log in
Report this content
View site in Reader
Manage subscriptions
Collapse this bar