 Facts are Sacred has just been published in China. This is the new introduction written for this edition.
When Western data journalists think about China, it’s often as the subject of data journalism, rather than a source of it. And you don’t have to search hard for smart examples of interesting work: just take Propublica’s guide to which international news outlets are blocked each day or Thomson Reuter’s award-winning guide to political connections.
But increasingly, China’s reporters are the practitioners of data journalism, too. The country is at the brink of something that looks genuinely exciting. Is this potentially the most-influential and important exercise of data journalism anywhere in the world?
Chinese media organisations have been quietly getting on with this for some time — this has been highlighted by journalist Yolanda Ma (@MaJinxin), based in Bangkok, who has a blog devoted to new data journalism across east Asia and speaks and writes about the phenomenon .
But while we have focused on new data journalism sites in Europe and the US, a number of interesting and popular sites have sprung up in China, many of them telling data stories regularly and in ways that are at least as compelling as those coming from established Western news organisations.
Here is just a small selection:
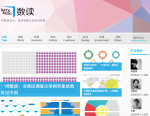
163.com Datablog
 163.com Datablog163.com is a popular web portal owned by internet company Netease. It regularly publishes dataviz and blog posts with a focus on comparing China to other countries and to change over time. A quick glance at the site today shows articles on human trafficking, China’s ‘artificially high’ drug prices and data fraud. It is newsy and fast and uses visualisations to tell the story.
Datanews, Caixin
The financials and business network has an established data journalism operation which covers topics from corruption and the environment through to real estate and food safety. Check out the site today and you may find data stories exposing corruption in major corporations, or a map showing where air quality is best and worst in ten cities across the country.
Matrix, Sohu
The internet company’s visualization blog displays static infographics on subjects including the Scottish independence referendum, ISIS, salt mining and Ebola
This is just a selection — the whole area is becoming competitive, just as it is in the US or the UK. And haven’t even begun to touch on the great work done by Hong Kong’s South China Morning Post.
There was a time when the Guardian Datablog was alone in producing daily data analysis and stories. But now data is part of mainstream reporting, as normal as using the internet or email around the world.
So how do you stand out in a world where everyone is producing infographics and data stories? There are two ways to distinguish what you do from the rest, and they are linked.
Firstly, accessibility. Journalism has always functioned best when the reporting has made stories clearer and easier to understand. It’s fine for you to be the cleverest person in the room; but much smarter for you to be the one everybody else understands. It’s easy to get bogged down in methodology and tools and forget what you are really doing is producing a story; data is a key part of the story but not it’s defining one. The reason that statisticians, by and large, don’t get into journalism is because that’s your job — to become a better reporter, not a better statistician.
Secondly, and crucially, it is about openness. Just because governments publish data doesn’t make them automatically open and transparent. Until it’s used that data is really just in an inert state, a state which is transformed when the numbers are brought to life by the data journalist and the team around them.
Meanwhile, as a data journalist, the first job is often finding the data, cleaning it and then getting it into a state where you can use it to tell your story. The logical next step, often forgotten, is to publish it, make it available and give it back to the world in a state where others can re-use it too.
The future of data journalism will be one where the closed world of old journalism fights the newer world of open journalism; a place where we’re not afraid to share our information with our readers in the hope they can help make what we do better.
China’s data journalists are at a place now where they can make that choice: to pursue new journalism in a way that has the potential to not only change their country but also the world. Anyone can do data journalism, given the right tools and potential. Taken to its logical extreme, that means anyone can be part of a group that alters everything forever. And I can’t wait to see what happens when they do.


Discussion
Trackbacks/Pingbacks
Pingback: Analyzing China’s data journalism through a piece of data news | mdia5003t11a5 - June 1, 2017
Pingback: 爱范儿到访了 Google 总部,问到了这三个 Google 趣闻动向 - 来科技-来科技 - May 18, 2016
Pingback: Increasingly, China’s reporters are the practitioners of data journalism | Liquid Newsroom - June 28, 2015