This US election season, you will see a lot of maps. And mostly, they will look kind of like this:
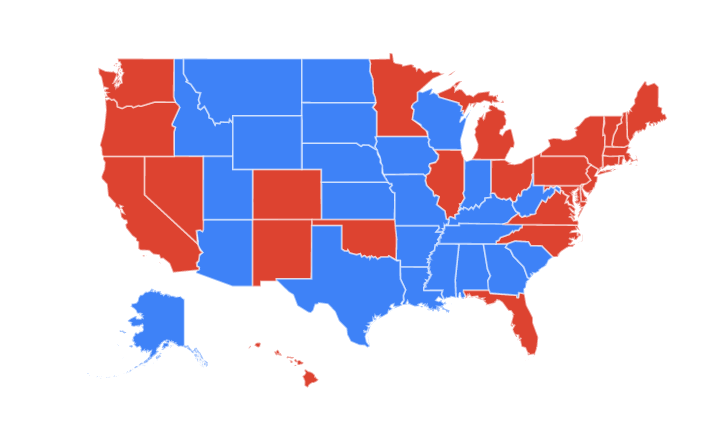
And what’s wrong with that? It is, after all, what the United States looks like.
But try and find Rhode Island or Connecticut. Tricky, isn’t it? But it’s not just finding the states that’s difficult. It’s getting a sense of how “big” those states actually are. After all, New York — with 8.4M people — is barely more than a pixel, while Washington DC is roughly the same population of Wyoming.
People have begin to notice that accurate geography isn’t always the most meaningful way to understand a map. Check out this animation, from Vox on the problems with the traditional election map.
So, if you want to see meaningful data on a map, you have to go further. What if you could create a map in proportion to the data you’re trying to show? Welcome to the world of cartograms.
A cartogram is a distorted map. Rather than reflect geographic boundaries and spaces, it’s changed to more accurately represent the data it’s showing. They’ve been around since at least the 1960s, often as a tool for academic geographers. In the UK, Danny Dorling and Ben Hennig have turned them into an artform, representing multiple different types of social data in cartogram form, from stretched maps to maps comprised of hexagons.
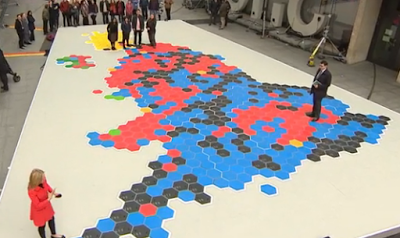
The UK’s general election last year was the first cartogram election — Kenneth Field noted how a number of newsrooms used hex maps to show the results, including the BBC’s on air show.
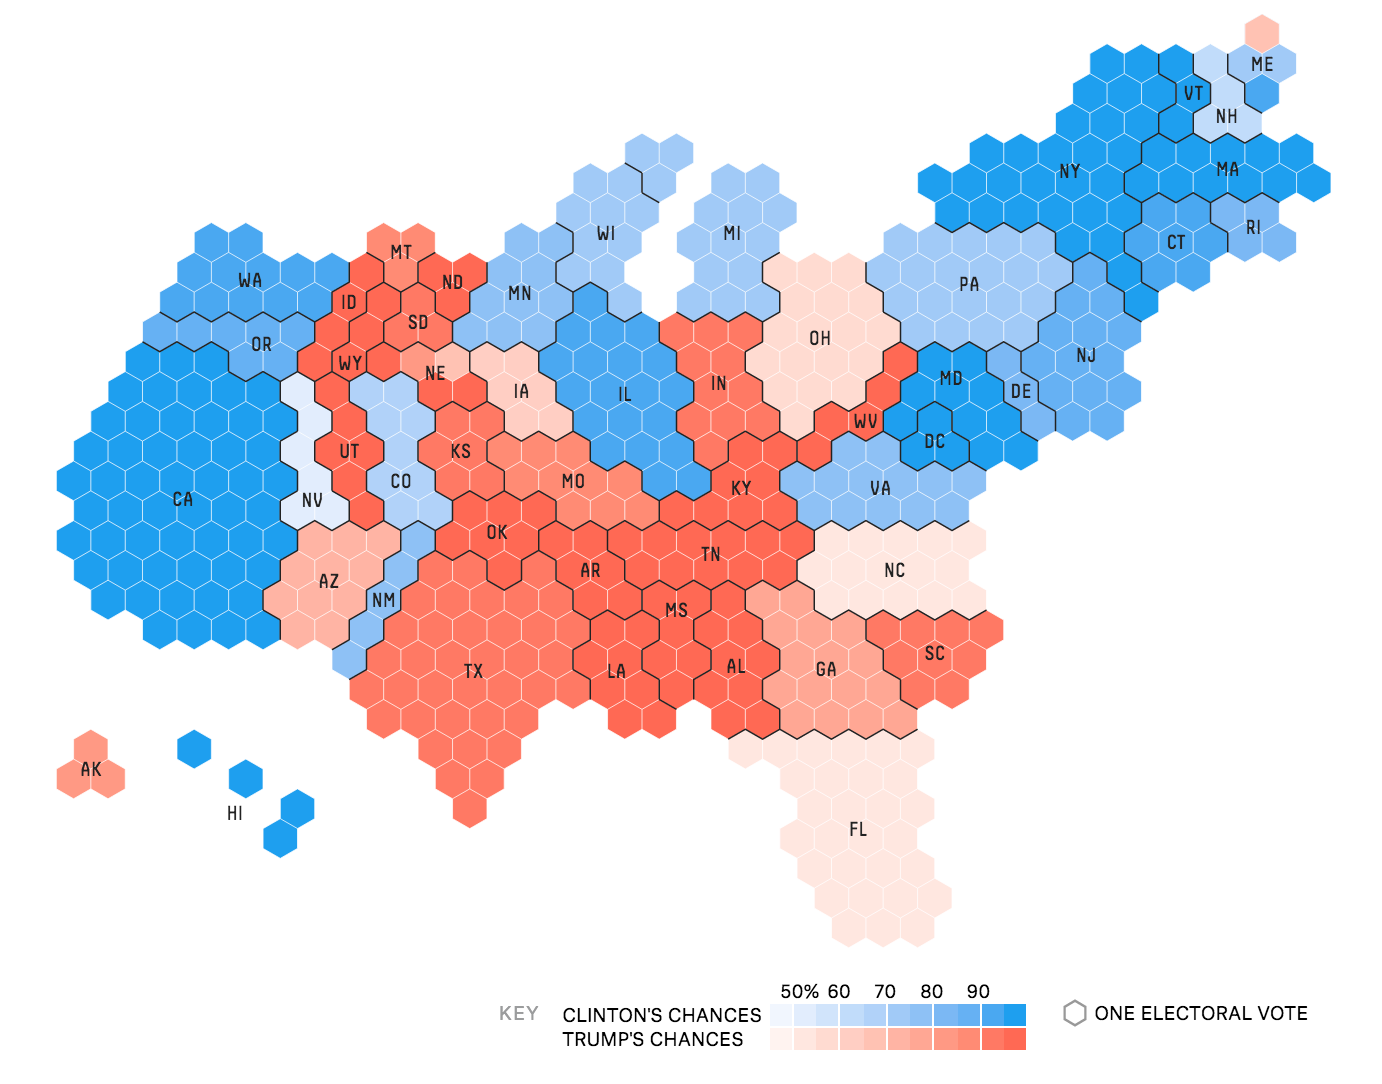
But it’s not just a British phenomenon — US designers have been thinking heavily about how use cartograms. And this election season, there are rather a lot of them around:
One of the most effective is this one, explaining the electoral college votes in FiveThirtyEight.
But how do you make one for yourself? There are lots of tools out there to create a traditional map, but what if you want to make a cartogram? Where would you even begin?
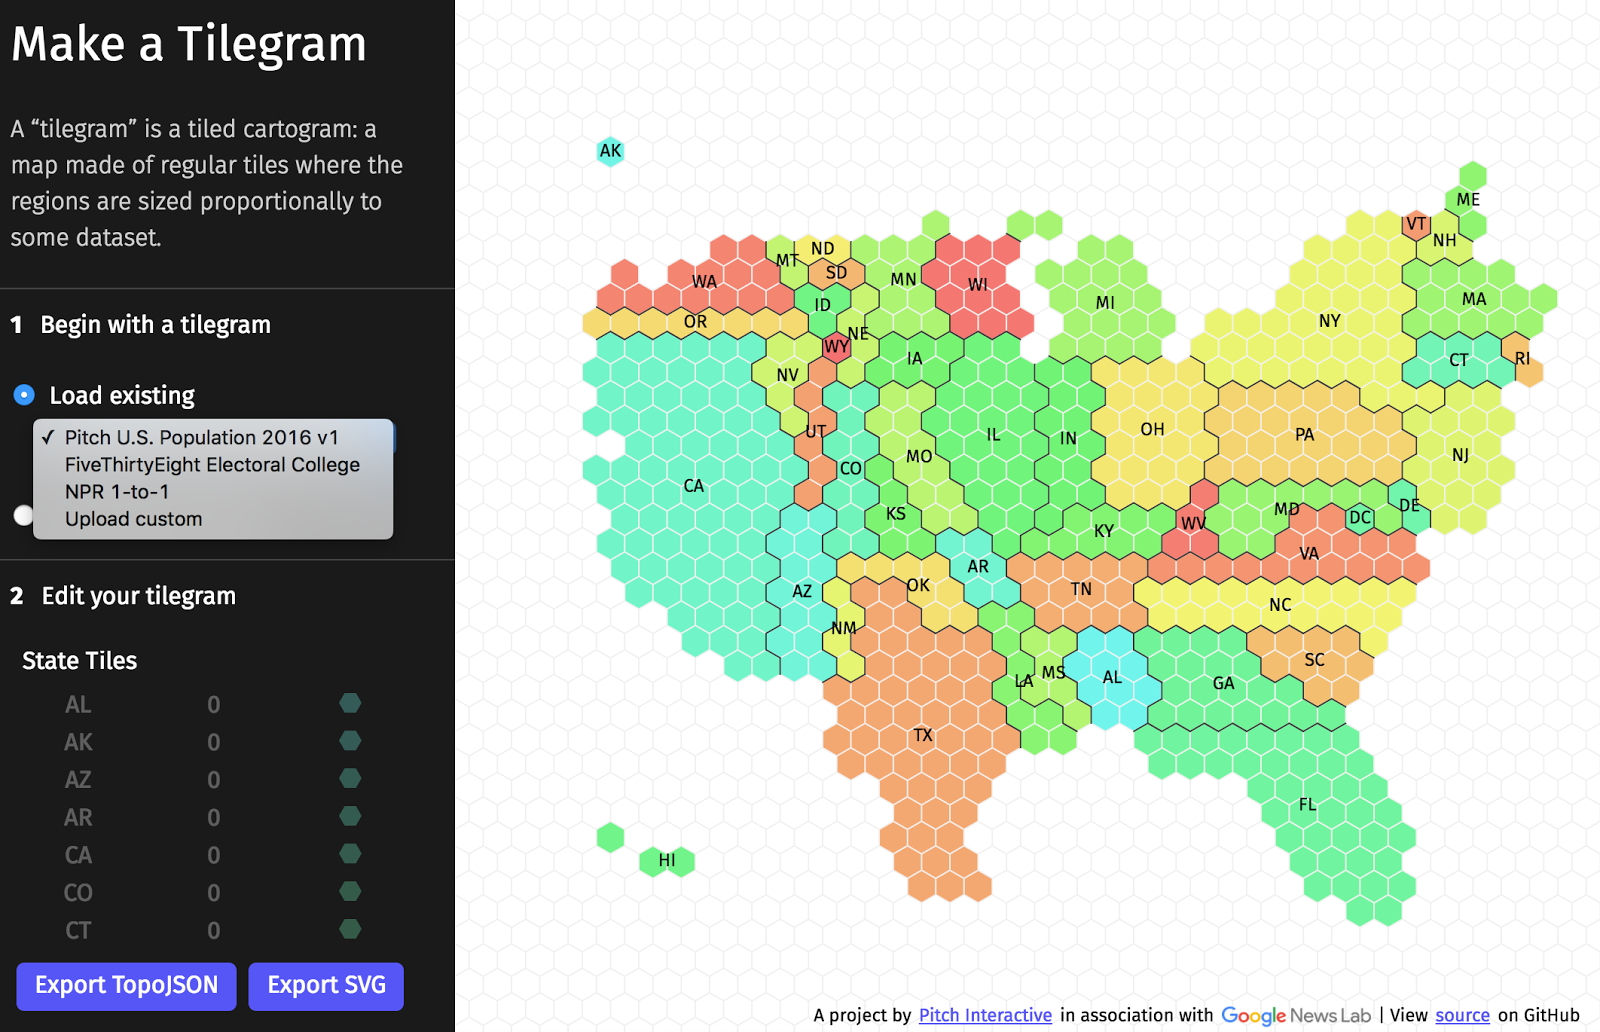
We wanted to make it easier. This is where Adam Florin and Jessica Hamelcome in with Tilegrams. The two Pitch Interactive designer-developers have developed this tool so that you can build your own cartogram.
The tool is designed for serious developers and amateurs (like me) who want to make their own hexmaps. It’s published on github so anyone can take the code and re-use it. It allows you to make both static and interactive maps.
How does it work?
Step 1: Choose a pre-prepared map
It comes pre-loaded with a number of key US hexmaps, to get you started, including the FiveThirtyEight-style map of the electoral college, the NPR state visual and Pitch’s hexmap of the US population, where each hexagon represents 500,000 people.
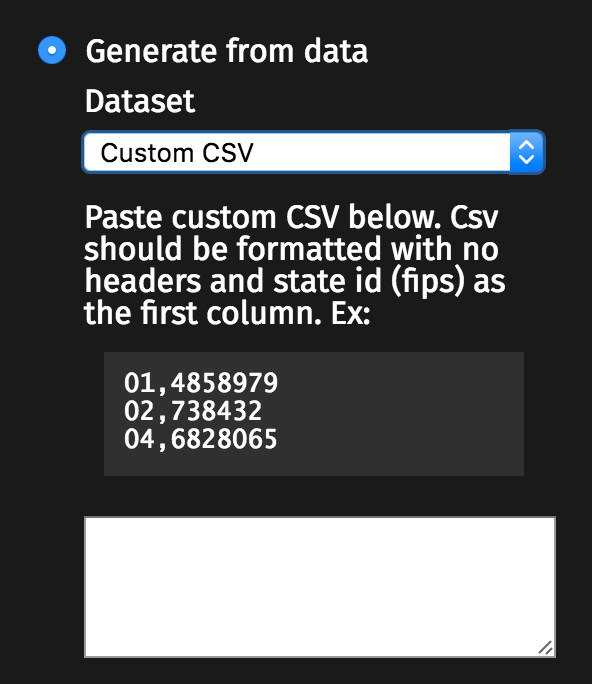
Step 2: choose your data
If the pre-loaded maps aren’t what you need, then choose a dataset and see it visualised by clicking ‘generate cartogram from dataset’. You can also upload and paste in your own dataset in CSV format.
Step 3: edit the data
The ‘resolution’ slider changes what each hexagon represents. And if you don’t like the way the map looks, you can drag the hexagons around to create your own map style.
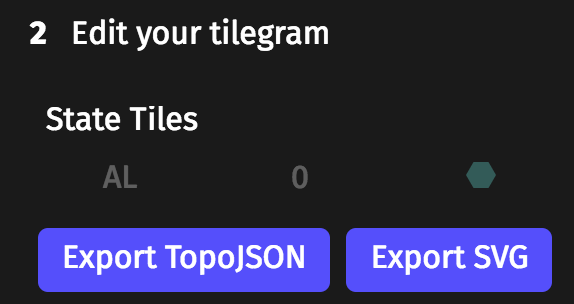
Step 4: export the visual
There are two export options: svg to produce a static image that can be edited afterwards; and TopoJSON for the interactive version.
You can read more about how to use it in this blogpost from the Pitch team.
We can’t wait to see what you do with it. Time to see the world differently.


Leave a comment